FPGA Zero-IF Spectrum Analyzer
A digital zero-IF receiver that sweeps a quadrature local oscillator and uses CORDIC processing to measure signal magnitude without multipliers or dedicated DSP blocks.
Overview
For ECE241, I built an analog-style spectrum analyzer entirely in digital logic. The design uses a zero-IF, or homodyne, receiver architecture on an FPGA: it tunes to one frequency at a time, measures the signal strength at baseband, and repeats that process across a configurable sweep.
Unlike an FFT-based analyzer, the sweep is not restricted to linearly spaced frequency bins. The local-oscillator frequency can move through an arbitrary sequence of points, which makes the measurement range and resolution directly configurable.
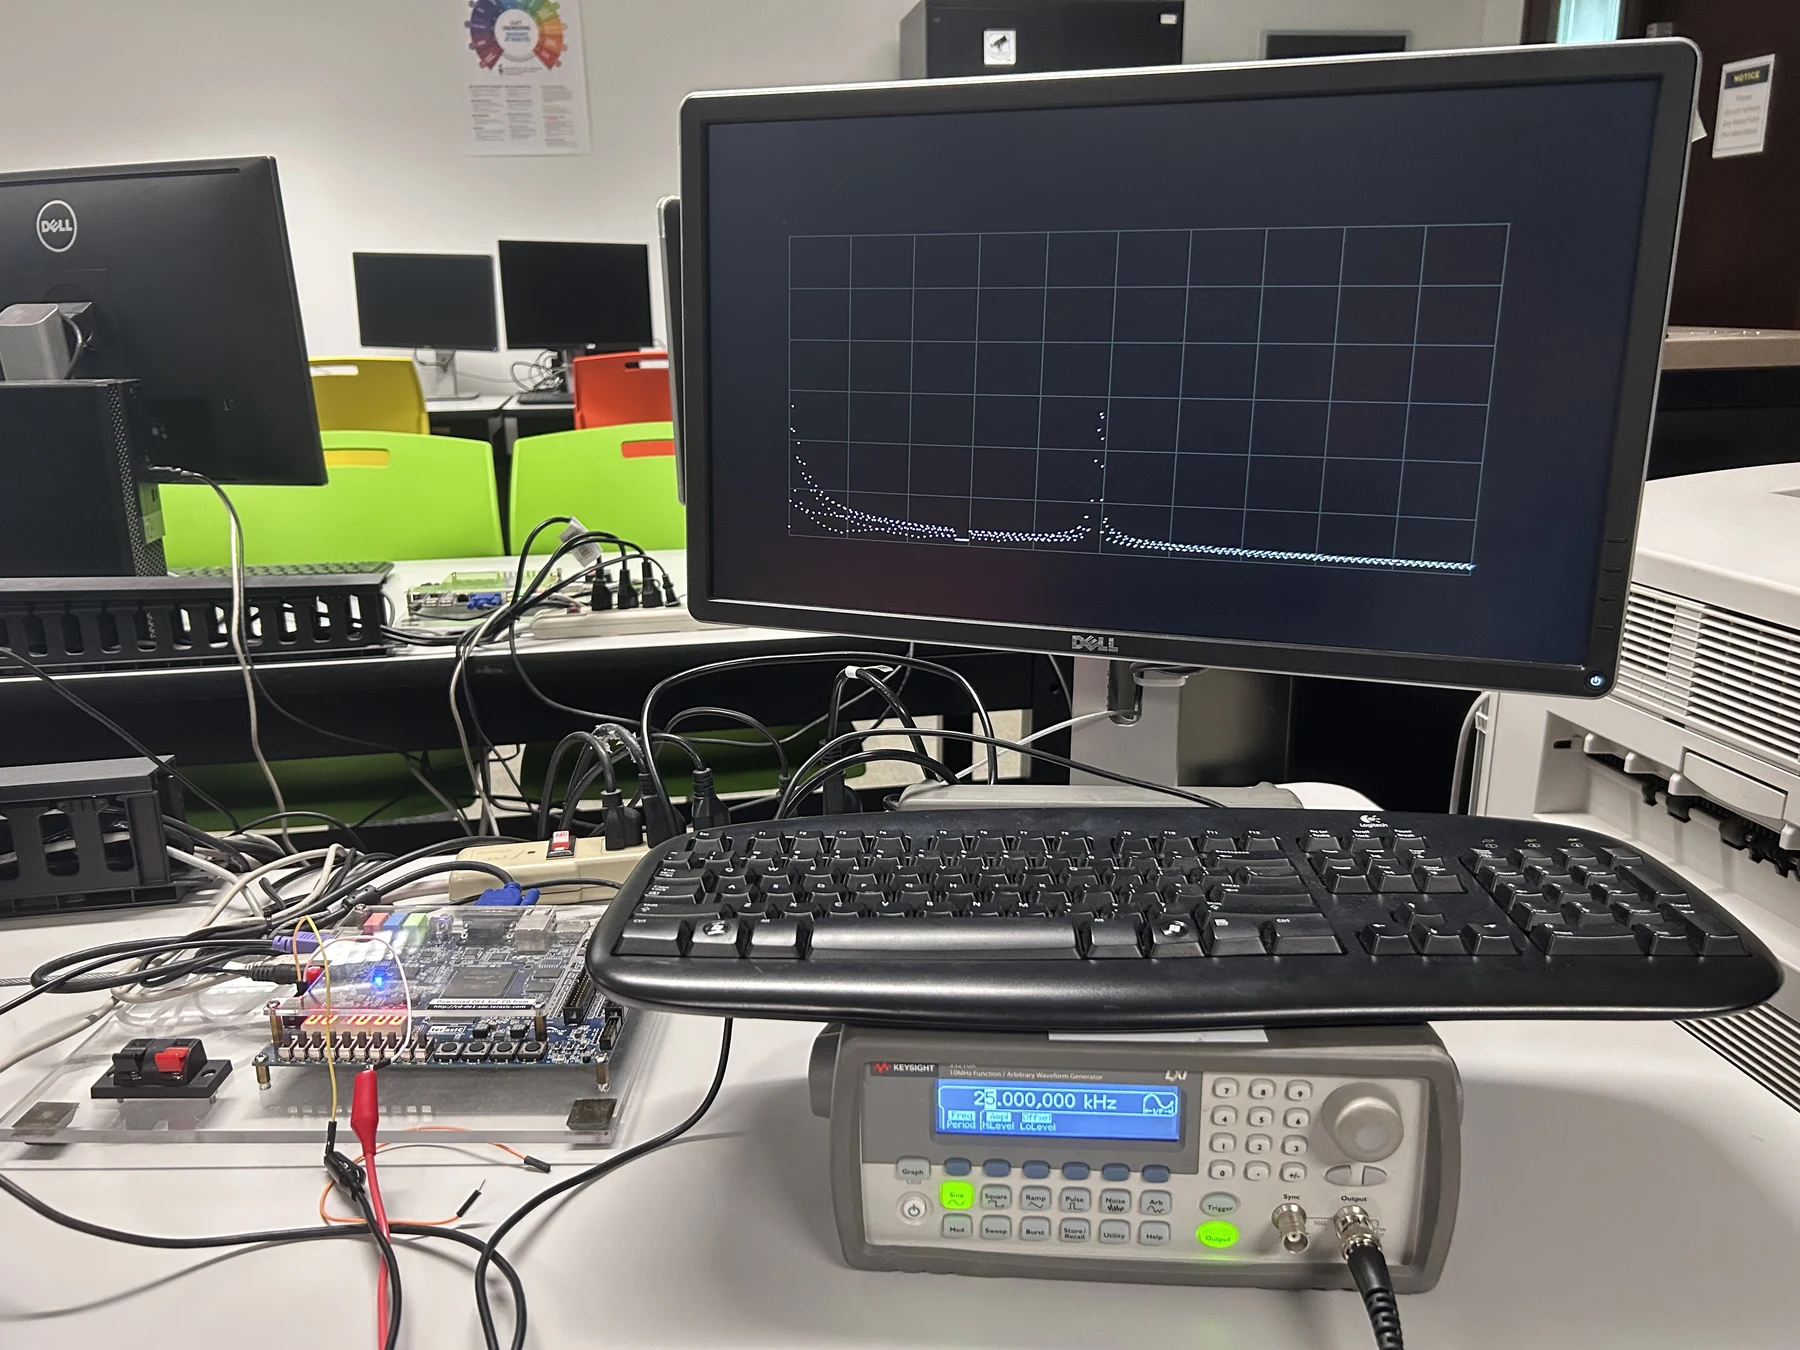
Bench demonstration of the FPGA receiving a generated test signal and drawing the measured spectrum.
Zero-IF signal chain
The incoming signal is mixed with a quadrature local oscillator to produce in-phase and quadrature channels. Low-pass filters remove the high-frequency mixing products and leave the baseband I/Q components. Their vector magnitude represents the signal strength at the current LO frequency.
Sweeping the oscillator and repeating that measurement builds the spectrum trace:
- Generate the quadrature local oscillator.
- Mix the input into baseband I and Q channels.
- Low-pass filter both channels.
- Compute the I/Q vector magnitude.
- Record the result and advance the LO frequency.
CORDIC-only processing
The main implementation constraint I set was to avoid dedicated DSP resources. The signal-processing path uses CORDIC operations built from shifts and additions, with no multipliers.
CORDIC rotation mode generates the quadrature LO and performs the mixing operation. After filtering, vectoring mode calculates the magnitude of the I/Q pair. A BKM logarithm block then converts the result to a decibel scale for display.
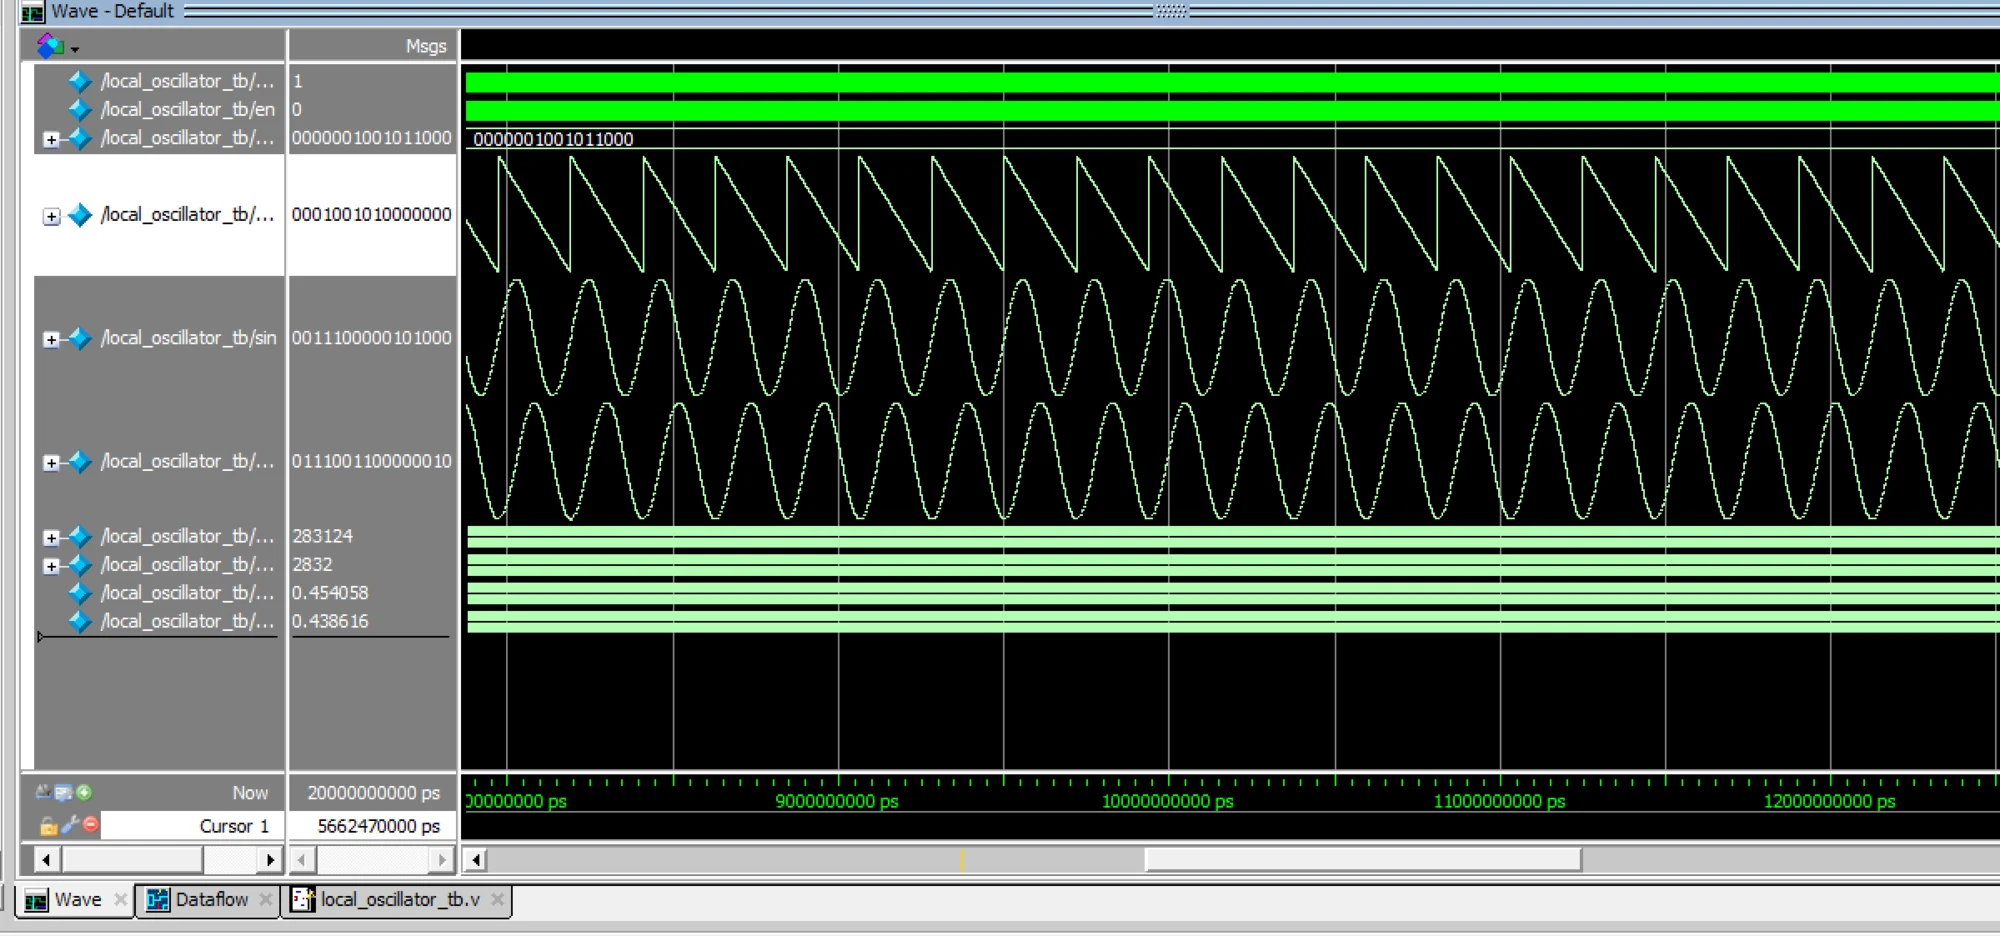
CORDIC rotation output: phase accumulator, sine, and cosine. The example uses a negative frequency.
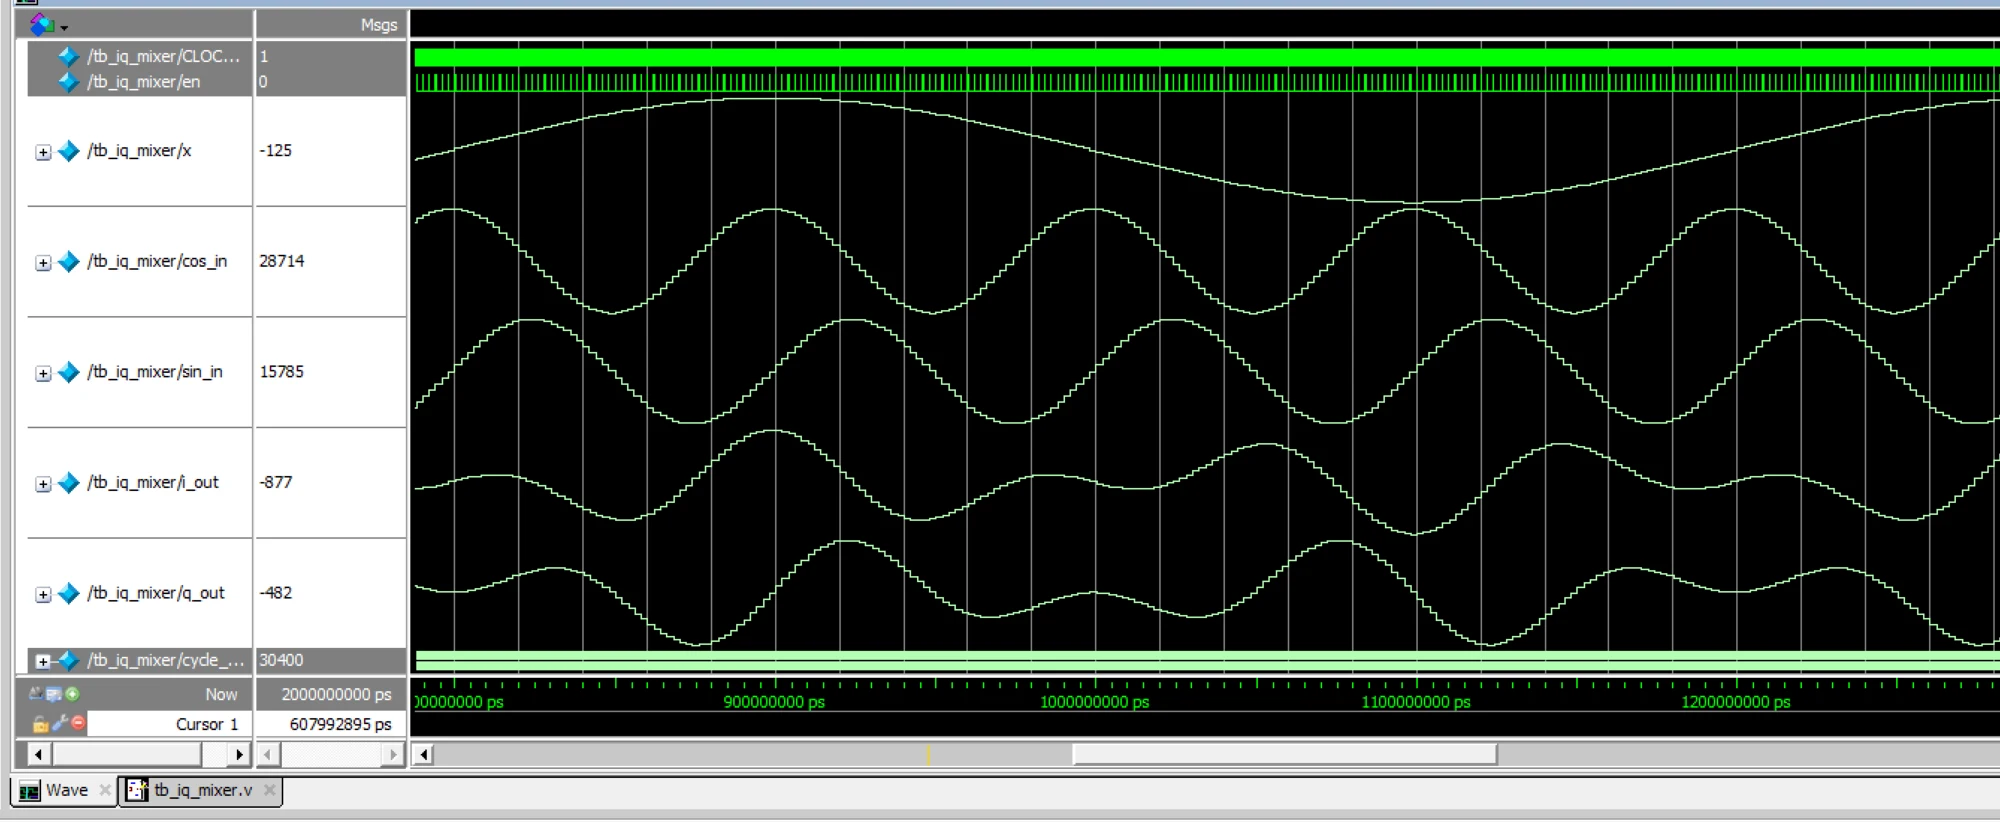
Using the CORDIC rotation as the quadrature mixer.
Development and verification
The CORDIC was verified in ModelSim as a standalone block before it was integrated into the receiver. Early simulations exposed incorrect output behavior and provided a reference for debugging the fixed-point implementation.
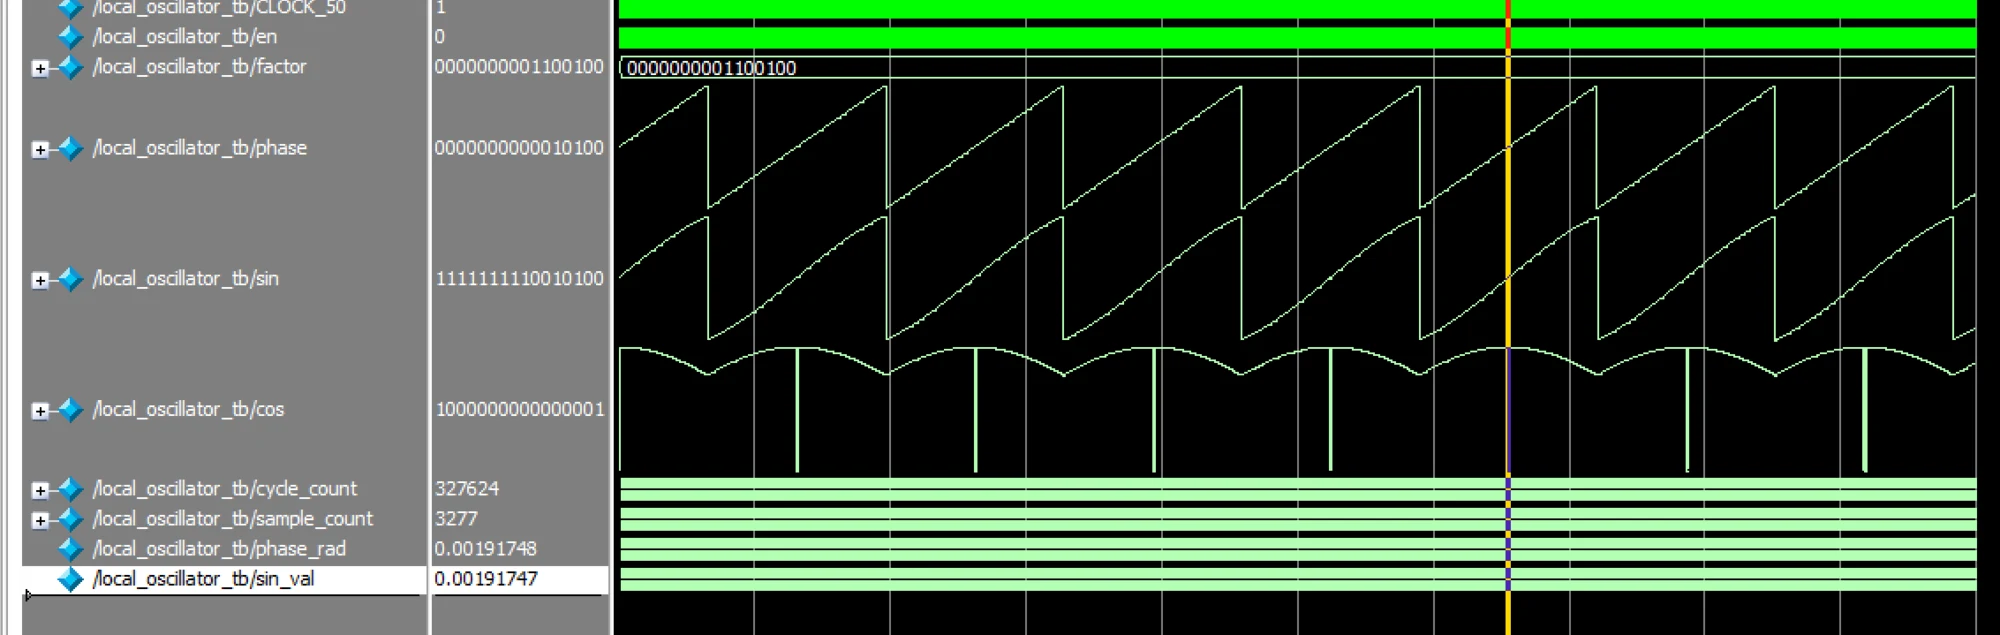
An early CORDIC simulation before the output was corrected.
I also tested the filtering path with a sine-wave input and checked the resulting sinc response before combining it with the mixer and magnitude stages.
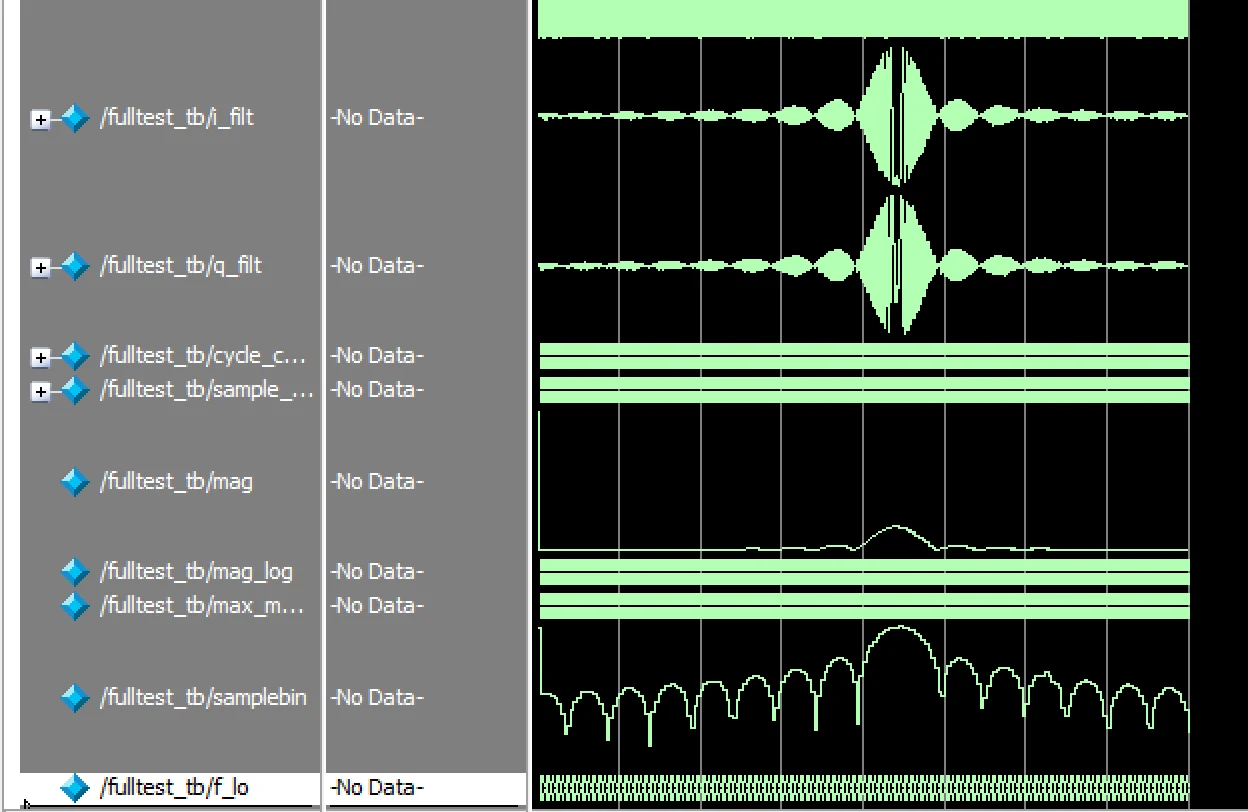
Sinc response from a sine-wave test input.
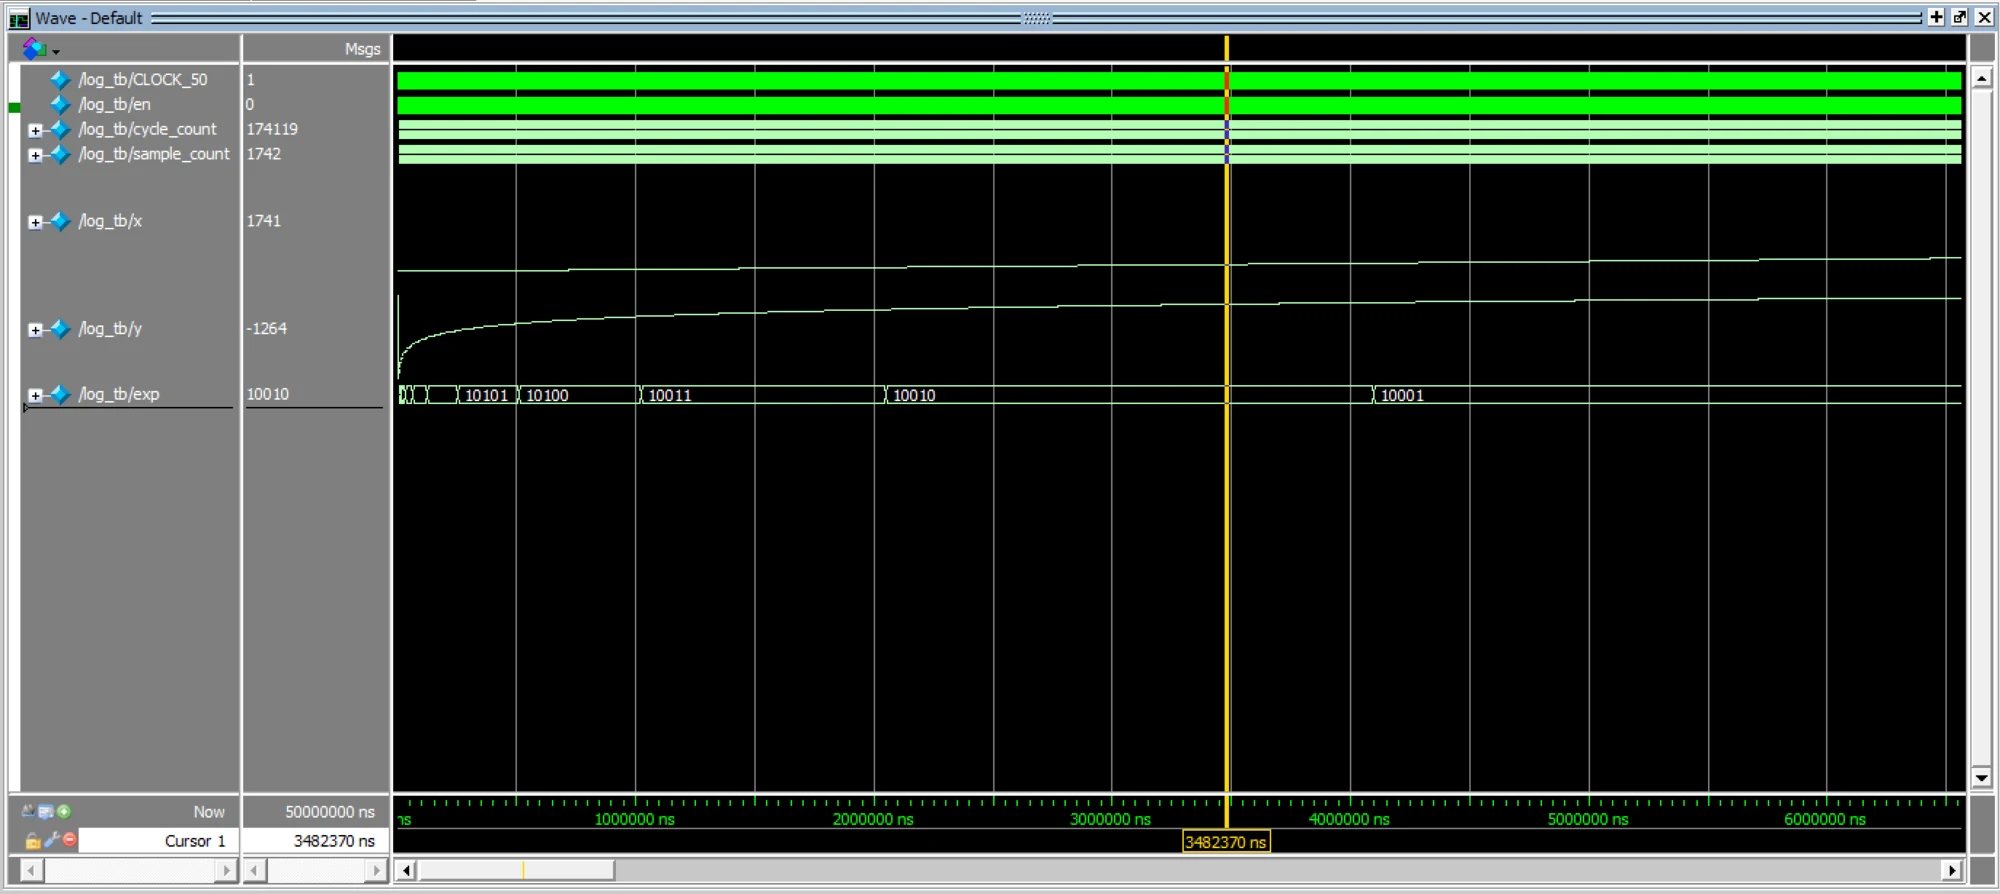
BKM logarithm module used to convert the measured magnitude to decibels.
ADC interface debugging
The ADC supported sampling rates up to 300 kS/s, but timing skew between the SPI signals caused capture errors at the maximum rate. I debugged the FPGA SPI driver on the oscilloscope and reduced the interface to 250 kS/s, where it operated reliably.
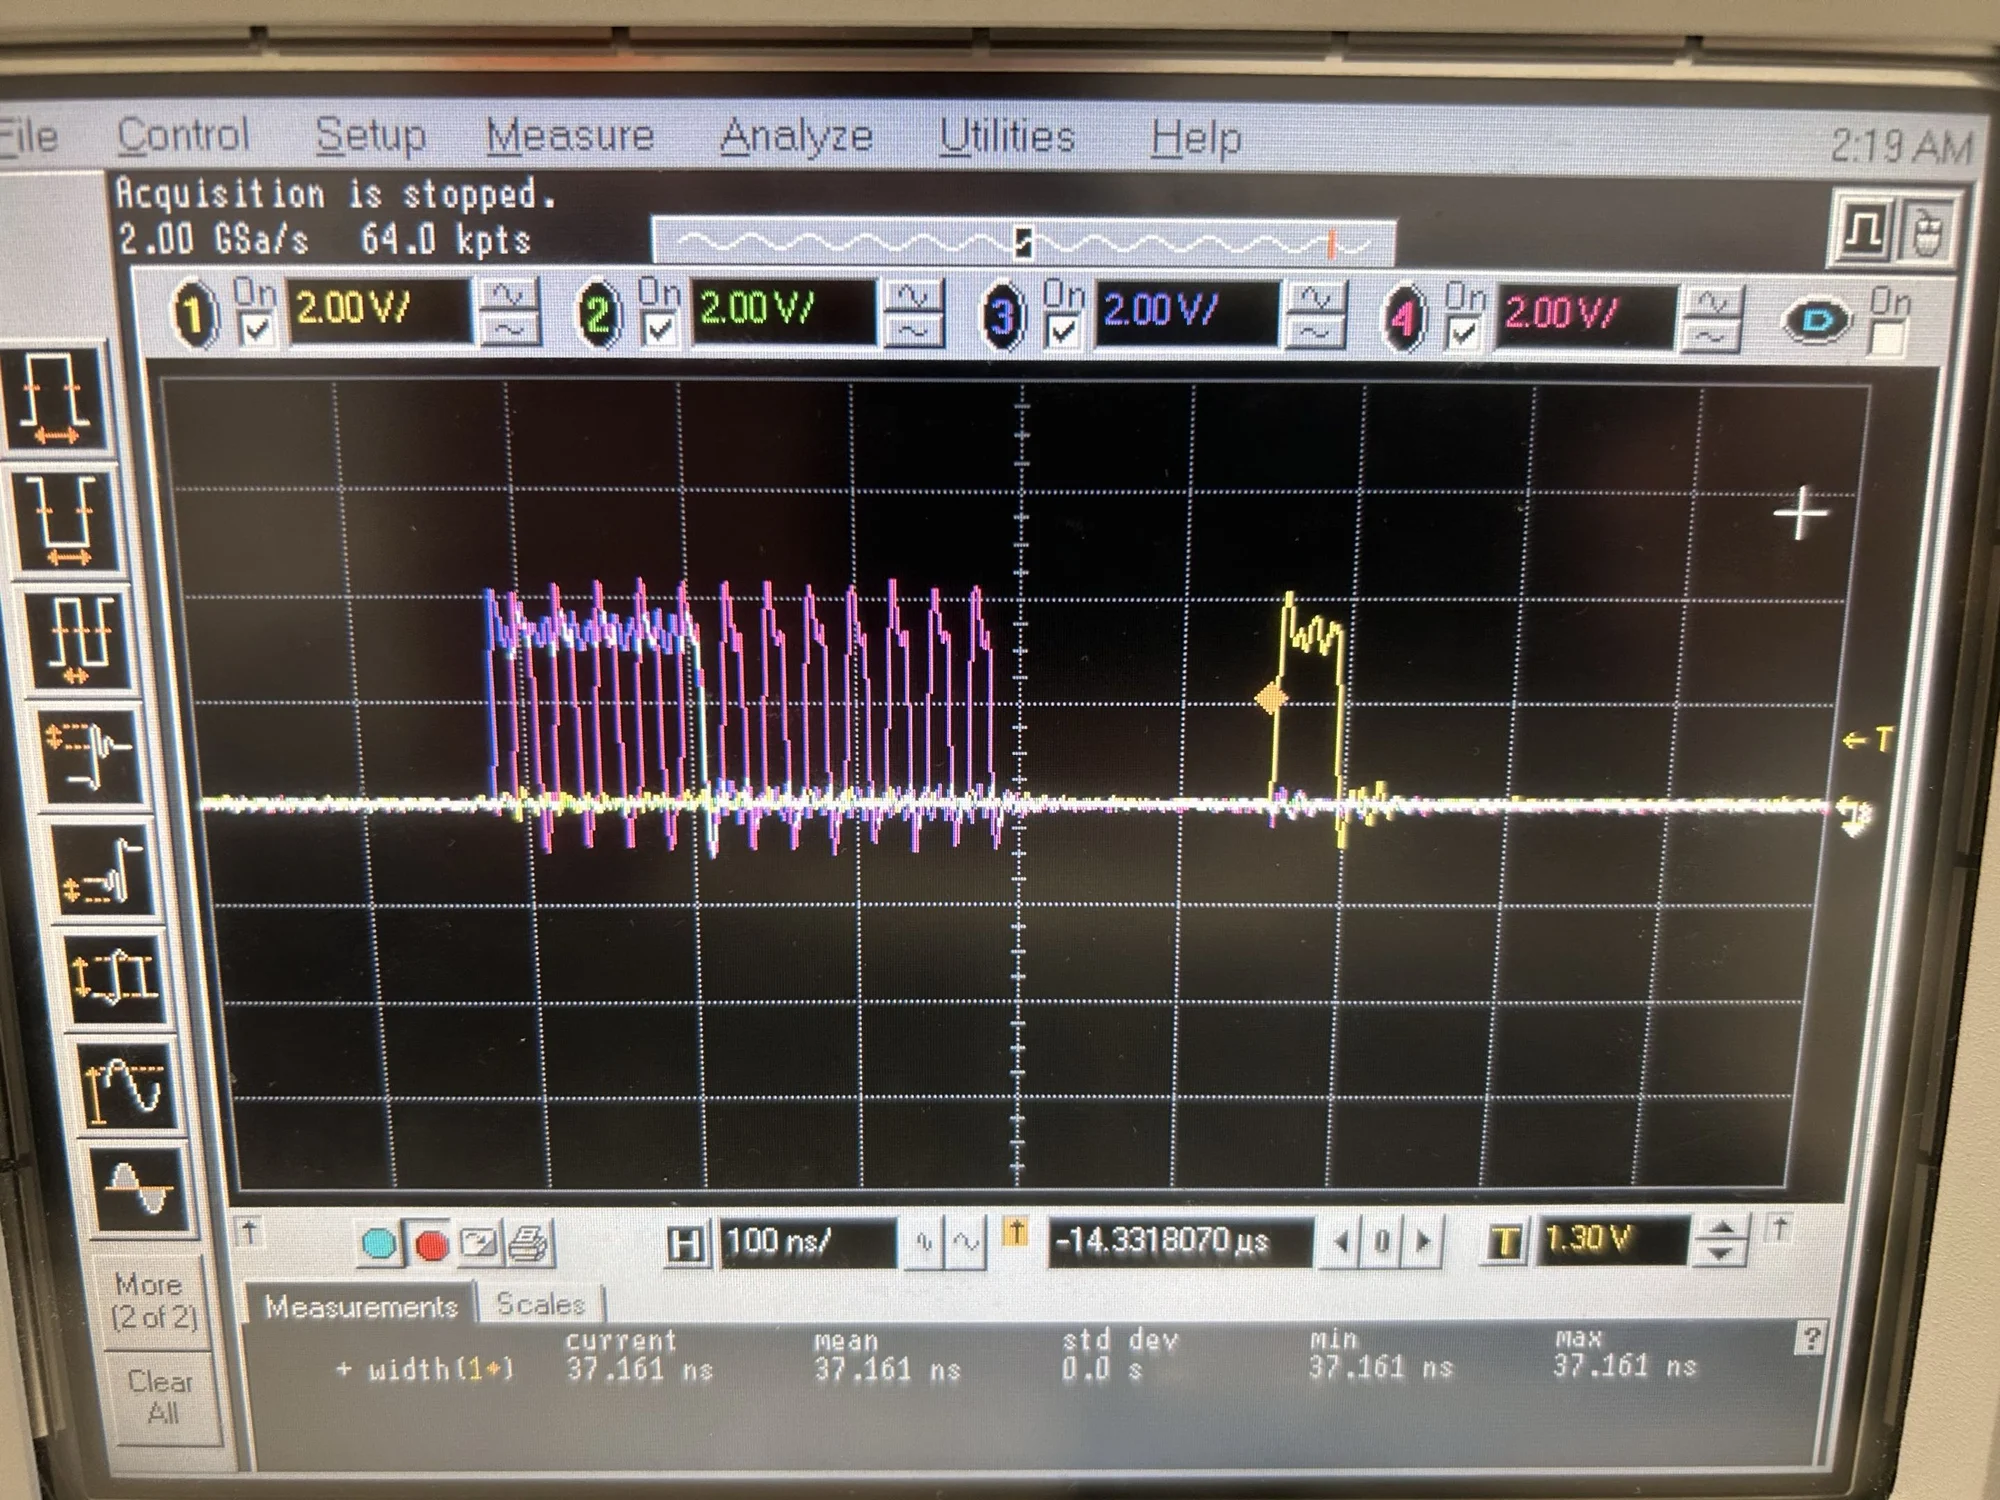
Debugging the ADC SPI timing on the oscilloscope.